August 11 of 2017
A Descending Triangle on Place for Daily Chart Averages (2-day average) (swing trade) Short Sell Increasing
Business Gap Opportunity is 9.64%
Lowe Range: 15.75
High Range: 17.43
Support Level: 16.25
Self-Correction Level: 16.59
Resistance Level: 16.93
Business Gap Trading Alert: Sell
Bollinger Top: 17.39
Bollinger Bottom: 16.89
SMA-20: 17.14 [price below]
SMA-50: 16.95 [price below]
SMA-200: 14.84 [price above]
Trend Performance:
Uptrend Status: Neutral
Downtrend Status: Downtrend
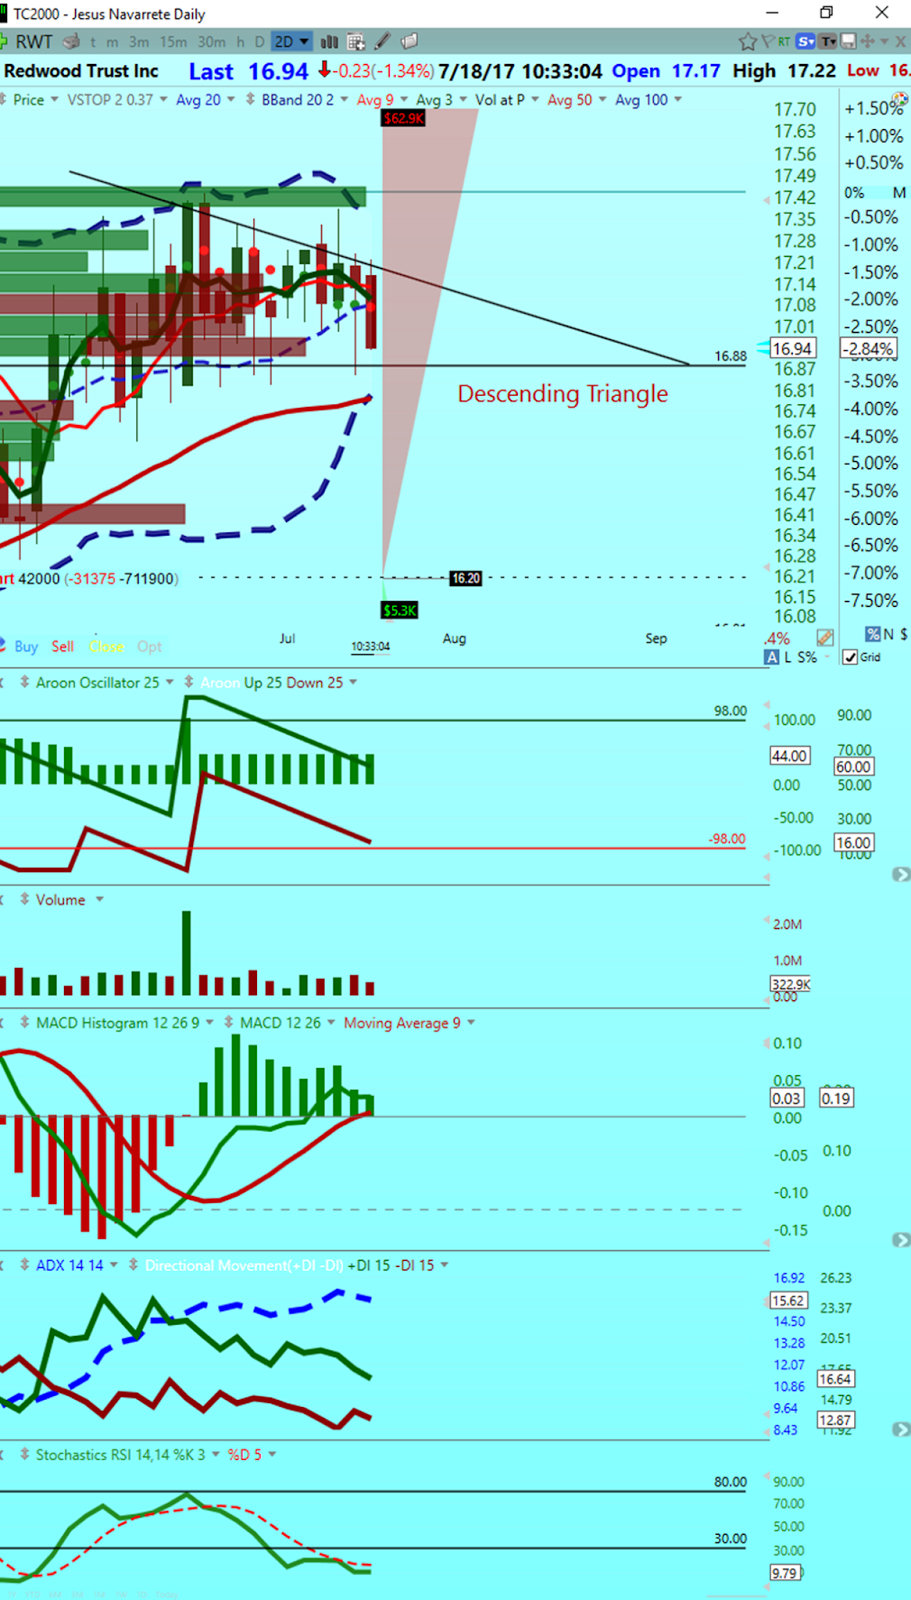
July 18, 2017
A Descending Triangle on Place for Daily Chart Averages (2-day average) (swing trade) Short Sale Position Open
MACD histogram and line are in the negative area (-0.03 from 0.03) territory neutral to negative averages, and the price is moving down.
August 11 of 2017

July 18 of 2017


A Descending Triangle on Place for Daily Chart Averages (2-day average) (swing trade) Short Sell Increasing
Business Gap Opportunity is 9.64%
Lowe Range: 15.75
High Range: 17.43
Support Level: 16.25
Self-Correction Level: 16.59
Resistance Level: 16.93
Business Gap Trading Alert: Sell
Bollinger Top: 17.39
Bollinger Bottom: 16.89
SMA-20: 17.14 [price below]
SMA-50: 16.95 [price below]
SMA-200: 14.84 [price above]
Trend Performance:
Uptrend Status: Neutral
Downtrend Status: Downtrend
July 18, 2017
A Descending Triangle on Place for Daily Chart Averages (2-day average) (swing trade) Short Sale Position Open
MACD histogram and line are in the negative area (-0.03 from 0.03) territory neutral to negative averages, and the price is moving down.
Aroon Indicator the positive line at 88 descending from 100. The Aroon lines crossed the trend performance will be more extensive and aggressive for the next 15 days.
ADX strong at 16.58 from 15.62 moving up indicating the very weak performance is making a change to a very strong negative performance.
+DI 15 -DI 15 on a reversal of trend
Top 12.83 from 16.64 moving to negative performance, Bottom 28.16 from 12.87, moving up to a negative performance.
Stochastic RSI oversold at (fast and slow at the same level 4.63 from 23.10)
Support Level 16.25 (0.58 to be crossed)
Self-Correction Level 16.59 (0.24 to be crossed)
Resistance Level 16.93 (0.10 crossed)
August 11 of 2017

July 18 of 2017


No comments:
Post a Comment